Learning Data Science, Day 1 – Introduction to Data Science
So I decided that instead of trying to remember JavaScript, I'm going to jump into something else. Being as the next module in my masters focuses on information and visualisation, what better than trying to figure out data science?
Since I never really learned statistics either, this is going to be ridiculously helpful in the future as it is. Yay, data!
What is Data Science?
Data Science is about finding patterns in data, through analysis, and make future predictions.
Yeah, god, I really do need a good guide to all this. I love playing with the data, I love finding patterns, but actually being able to make proper predictions instead of going "I don't know, something will happen"? I need that. A lot.
Like, I love sticking UTMs in emails and then building reports that show me what people have been clicking on through them, but can I actually do anything with that except to go "50 people clicked that link"? Nope.
I need more.
I mean, okay, I am more than happy to leave the really heavy lifting to actual "I have a PhD in Mathematics" or "I have been hired to be a data scientist" people, who, by the way, have been absolutely delightful people whenever I've met them and worked with them, but little things? Yeah, I can do that, and leave them to do the Big Data Crunching.
There's a section in here on how a Data Scientist works. I dig this list:
- Ask the right questions
- Explore and collect data
- Extract the data
- Clean the data
- Find and replace missing values
- Normalise data
- Analyse data, find patterns, and make future predictions
- Represent the result
Yesssss. Give it to meeeeee.
Structured Data versus Unstructured Data
Unstructured data is the nonsense we collect all the time. They give an example using health data (pulse, steps, etc.), but then their example of structured data doesn't relate to the unstructured data.
They throw you straight into an array without giving any context for the numbers. Which is fine, I guess, these are just examples, but it would help to have a bit more context.
Like
Array = [80, 85, 90, 95, 100, 105, 110, 115, 120, 125]
print(Array)
What even are those numbers? Are we measuring pulse? Money? Number of times I'm asking annoying questions?
But, okay, unstructured data is just random nonsense with a lot of extraneous information, structured data is the hard details we can stick into an array.
Database Tables
They then have database tables, which are better at giving the context. Databases are made of columns and rows, with variables being in the columns and rows and are something that can be measured. The first row is the label for the variables, so if you have 11 rows, you have 10 variables.
All pretty basic for database tables. I'm used to doing this by hand in Sheets or similar, so this is not remotely new.
And again, they're focusing on health data, but, I think, in this case, I need to find a more interesting source of data.
But since I'm working with small sets while I'm learning, I think I'll just make up a random table.
I don't actively collect Funko Pops. I just end up buying ones for things I like. So we're going to have a table of Living Room Funko Pops, since I can see them all from the couch, and it's a small number.
| Star Wars | The Big Lebowski | Mr. Robot | Jupiter Ascending | The Book of Life | Godzilla |
|---|---|---|---|---|---|
| 6 | 1 | 1 | 1 | 1 | 1 |
So there we go. My data for today. Funko Pops.
If you're really interested, that's:
- C3PO, Jabba the Hutt, Captain Phasma, Rey, Rose Tico, Vice Admiral Holdo
- Maude Lebowski in her Valkyrie outfit
- Whiterose
- Jupiter in her wedding dress
- La Muerte
- Godzilla
(There are few more scattered around the living room, but I'm focusing on the ones that are actually on display, not "Oh, we got this as a gift and we just haven't put it away yet". Because while my brother got us a Silver Surfer to celebrate our silver wedding anniversary last year, I have yet to figure out where the hell to put it.)
Data Science and Python
They point out that they have a Python tutorial, which I might do later on. It would definitely help. But I'm focusing on the data today. They do list the specific libraries they're going to use, though.
Each has their own special features. Matplotlib is used for visualisation, which definitely has my attention, SciPy does linear algebra, etc. etc. etc.
Creating a DataFrame
So in the titles, they call it a DataFrame, but then in the sentences, they call it a data frame. It looks like it's because DataFrame is the actual Python term. Okay, cool cool cool.
Data frames are structured representations of the data. In this case, they're creating the DataFrame using Pandas, so it's time to get that Funko table into Pandas.
import pandas as pd

f = {'SW': [6], 'TBL': [1], 'MR': [1], 'JA': [1], 'TBOL': [1], 'G': [1]}

fp = pd.DataFrame(data=f)

print(fp)
And boom. I get a data frame.
   SW  TBL  MR  JA  TBOL  G
0   6    1   1   1     1  1
(I shorted the names of the columns to make it easier).
And I know that the 0 is there because the count starts from 0, not 1 and the names of the columns don't count as a row.
I should have had more data rows to really show it off. Maybe instead of just Funkos, I could also keep track of what's in my little display case of figures.
import pandas as pd

f = {'SW': [6, 13], 'TBL': [1, 0], 'MR': [1, 0], 'JA': [1, 0], 'TBOL': [1, 0], 'G': [1, 0], 'T': [0, 3], 'THM': [0, 3], 'R': [0, 1], 'A': [0, 1], 'GIJ': [0, 1], 'ST': [0,1], 'P': [0, 1]}

fp = pd.DataFrame(data=f)

print(fp)
   SW  TBL  MR  JA  TBOL  G  TL  THM  R  A  GIJ  ST  P
0   6    1   1   1     1  1  0    0  0  0    0   0  0
1  13    0   0   0     0  0  3    3  1  1    1   1  1
There are 13 Star Wars figures in the case, but no The Big Lebowski figures. There are no Tron: Legacy Funko Pops in the living room, but there are 3 figures in the case.
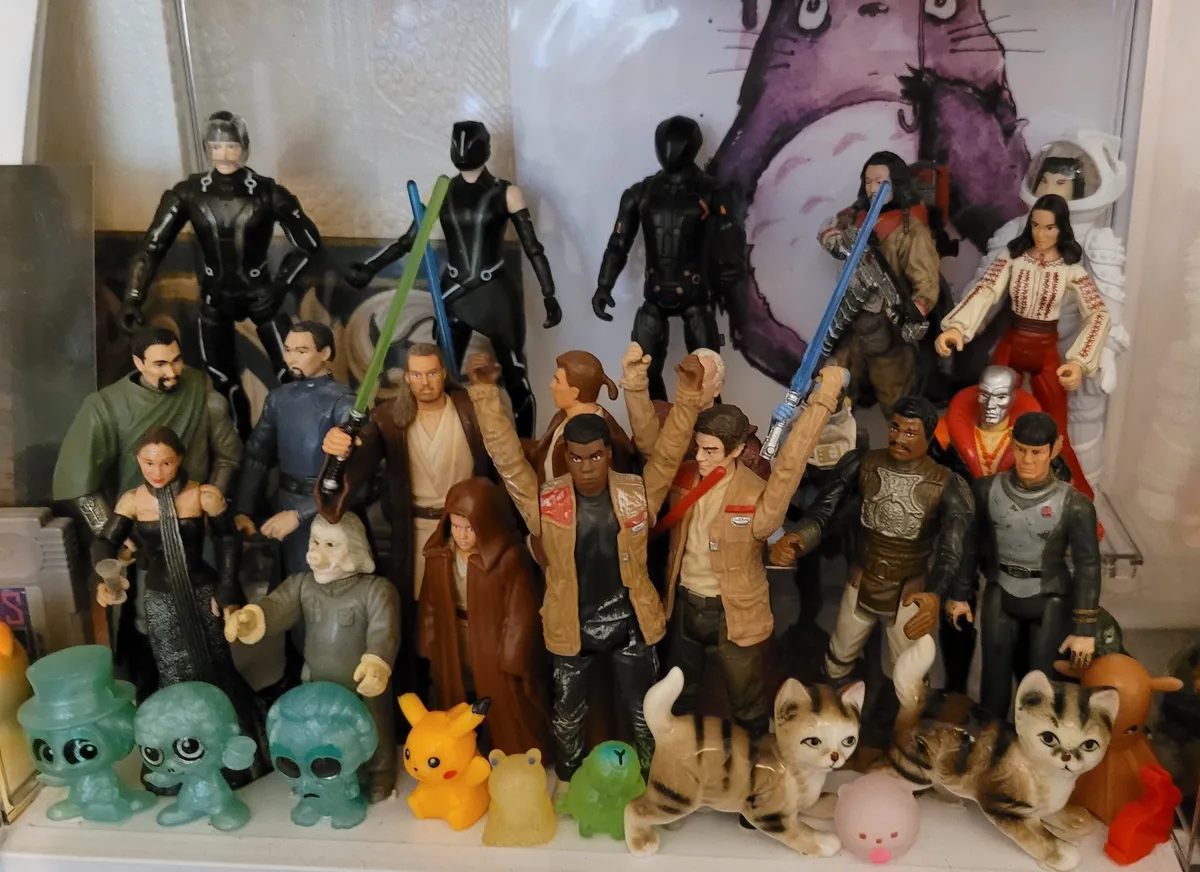
(I didn't include everything that's in the case that's on the bottom row. Most of them don't relate to anything, just look cute as hell. But, if you're curious, in the case we have Tron: Legacy, The Haunted Mansion, Raiders of the Lost Ark, Alien, GI Joe, Star Trek, and Pokémon as well as all the Star Wars stuff.)
So now that I have two rows, I can do more.
I can count the number of columns and the number of rows by using .shape:
count_column = fp.shape[1]
print(count_column)

count_row = fp.shape[0]
print(count_row)
And get:
13
2
Which is right. If I use .shape[1], I get the number of columns, and if I use .shape[0], I get the number of rows. Which will immensely help when I'm including a bunch of data, because I've already lost count when it's just 13, much less like 1300.
(And putting them all into a spreadsheet isn't going to help either, because then I'll have to figure out what number AAZ is.)
Day 1 — Results
- Unstructured data is just whatever we collect in any old format.
- Structured data is data we can put into an array.
- Databases are made of columns and rows.
- Variables are things that can be measured.
- The first row is the label for variables.
- There are specific Python libraries for working with data.
- Mostly it's Pandas, NumPy, Matplotlib, and SciPy.
- When you import in a library, you use 'import LIBRARY as SHORTVERSION' and then call the functions in that library as
SHORTVERSION.FUNCTION(). - If I want a DataFrame of my array
f, Iimport pandas as pdand then callpd.DataFrame(data=f). - If I want to know how many columns I have in my data, it's
shape[1]. - If I want to know how many rows are in my data, it's
shape[0].
Gosh, this was a lot, wasn't it? I'm breaking it up into two days, because now that I have the database and know how many columns and rows I have, I can do all the cleanup and analysis tomorrow.
(I actually did it all today, but it's a hell of a lot of reading, so I thought I'd give y'all a break.)
Today's Sticker

Another wonderful sticker from Jennifayrie, this time the Sailor Spoop. She is sadly not available as a separate sticker, but you can get her as a pin which is also ridiculously adorable. Or maybe you'll get her in the Spoopy Cuties Sticker Sheet.