Learning Data Science, Day 2 – Functions, Categories, Types, and Analysis
So I broke up the initial section of Data Science into two parts because it got a little long. And while I was enjoying myself, I was like "oh man, people are going to have a hell of a time reading this".
So after we've made the data table and figured out what it is, it's time to actually crunch the numbers!
Data Science Functions
There are three functions commonly used in data science – max(), min(), and mean().
So if we take my Display Case data and want to find which is the biggest number...
Case_figures_max = max(13, 0, 0, 0, 0, 0, 3, 3, 1, 1, 1, 1, 1)
print (Case_figures_max)
And I get 13, unsurprisingly. There are a lot of Star Wars figures in that case. (I am a sucker for cheap unwanted action figures, I can't help it. No one wants Space Jimmy Smits, so I have two. No one wants little Anakin, I will love him forever.)
Then I can find the smallest value.
Case_figures_min = min(13, 0, 0, 0, 0, 0, 3, 3, 1, 1, 1, 1, 1)
print (Case_figures_min)
Which gives me 0 because I pulled it from the Funko Pop/Display Case data, and there are a chunk of media tie-ins that aren't in the case.
Mean is determined using NumPy, so I have to import in that library before I can find the average number of action figures in my case.
import numpy as np

Case_figures = [13, 0, 0, 0, 0, 0, 3, 3, 1, 1, 1, 1, 1]

Average_case_figures = np.mean(Case_figures)

print(Average_case_figures)
And I get 1.8461538461538463, which means that, based on the 13 different media tie-ins I have between my Funko collection and my Display Case collection, I have just under 2 figures on average.
If I get rid of the zeroes and just focus on the case, it's an average of 3 figures per media tie-in.
I wish I had three GI Joe figures in there. I really could use a Baroness and a Zartanna.
Extracting and Reading Data using Pandas
So I can use Pandas to read CSVs, which is neat. They're using health data again, but I can totally just turn my Funko/Case data into a CSV in, like, five seconds.
SW, TBL, MR, JA, TBOL, G, TL, THM, R, A, GIJ, ST, P
6, 1,  1,  1, 1, 1, 0, 0, 0, 0, 0, 0, 0
13, 0,  0,  0, 0, 0, 3, 3, 1, 1, 1,  1, 1
So in order to get Pandas to read the CSV, I need to put in:
import pandas as pd

figure_data = pd.read_csv("data.csv", header=0, sep=",")

print(figure_data)
And I get
   SW   TBL   MR   JA   TBOL   G   TL   THM   R   A   GIJ   ST   P
0   6     1    1    1      1   1    0     0   0   0     0    0   0
1  13     0    0    0      0   0    3     3   1   1     1    1   1
Which is exactly as it should be. Woo. Excitement.
But I should really make that data a bit messy, since, y'know, data is always messy. So let me add another row with nothing in it, and then one with weird data.
SW, TBL, MR, JA, TBOL, G, TL, THM, R, A, GIJ, ST, P
6, 1,  1,  1, 1, 1, 0, 0, 0, 0, 0, 0, 0
13, 0,  0,  0, 0, 0, 3, 3, 1, 1, 1,  1, 1
,,,,,,,,,,,,
Pika, Pika, Chu, Chu, Pikachu, Chu, Pika, Chu, 10, 0, 12
Which gives me
     SW    TBL    MR    JA      TBOL     G  ...   THM     R    A   GIJ   ST    P
0     6      1     1     1         1     1  ...     0   0.0  0.0   0.0  0.0    0
1    13      0     0     0         0     0  ...     3   1.0  1.0   1.0  1.0    1
2   NaN    NaN   NaN   NaN       NaN   NaN  ...   NaN   NaN  NaN   NaN  NaN
3  Pika   Pika   Chu   Chu   Pikachu   Chu  ...   Chu  10.0  0.0  12.0  NaN  NaN
Oooh, I got text, I got NaN, this is a data disaster.
Luckily, I can drop anything that isn't a number through this little bit of code:
.dropna(axis=0,inplace=True)
axis=0 means I want to remove all rows that have NaN in them.
So I add that in...
import pandas as pd

figure_data = pd.read_csv("data.csv", header=0, sep=",")

figure_data.dropna(axis=0,inplace=True)

print(figure_data)
And boom, clean data is back again.
   SW  TBL  MR  JA  TBOL   G  TL  THM    R    A   GIJ   ST   P
0   6    1   1   1     1   1   0    0  0.0  0.0   0.0  0.0   0
1  13    0   0   0     0   0   3    3  1.0  1.0   1.0  1.0   1
(I do not know why suddenly it brings in decimals, but, whatever. I'll take it.)
Data Categories
When we analyse the data, we also need to know what kinds of data we're analysing. So there are two main categories, that can be split into two sub-categories each.
Quantitative Data
Data that can be expressed as a number or measured as a number. This can be discrete data (whole numbers) or continuous data (infinitely precise numbers).
If I had a group of people, the number of people would be the discrete data (because you can't have half a person), but their weight would be continuous data (because you can have half a kilogram).
Qualitative Data
Data that can't be expressed as a number or measured as a number. This can be nominal data, which can be free-form data, or ordinal data, which is a set of data.
So with that same group of people, if I were to ask them their gender, that would be nominal data, because gender is a construct and you can put anything as your gender, but I could also categorise them in a specific set of heights (short, medium, tall), which would be the ordinal data.
If I were to pull a person out of that group, I could then go "This is 1 person (discrete data), who weighs 189.25 kilograms (continuous data), who has declared themselves genderqueer (nominal data), and is of medium height (ordinal data)."
Neato.
Data Types
Once I have Pandas read the CSV, I can also have it tell me what kind of data I have by doing .info().
So I go with my cleaned up Funko/Display data in data.csv and code up:
import pandas as pd

figure_data = pd.read_csv("data.csv", header=0, sep=",")

print(figure_data.info())
Which gives me a heck of a lot of data.
<class 'pandas.core.frame.DataFrame'>
RangeIndex: 2 entries, 0 to 1
Data columns (total 13 columns):
 #   Column  Non-Null Count  Dtype
---  ------  --------------  -----
 0   SW      2 non-null      int64
 1    TBL    2 non-null      int64
 2    MR     2 non-null      int64
 3    JA     2 non-null      int64
 4    TBOL   2 non-null      int64
 5    G      2 non-null      int64
 6    TL     2 non-null      int64
 7    THM    2 non-null      int64
 8    R      2 non-null      int64
 9    A      2 non-null      int64
 10   GIJ    2 non-null      int64
 11   ST     2 non-null      int64
 12   P      2 non-null      int64
dtypes: int64(13)
memory usage: 340.0 bytes
None
They're all integers, which is great, because we want either int64 or float64 to give us numbers.
But if we had some that were objects and not numbers, we could change them up by adding .astype(float). Because these are all int64, I can turn one into float64...why not?
import pandas as pd

figure_data = pd.read_csv("data.csv", header=0, sep=",")

figure_data['SW'] = figure_data['SW'].astype(float)

print(figure_data.info())
And now my Star Wars column is float64
<class 'pandas.core.frame.DataFrame'>
RangeIndex: 2 entries, 0 to 1
Data columns (total 13 columns):
 #   Column  Non-Null Count  Dtype
---  ------  --------------  -----
 0   SW      2 non-null      float64
 1    TBL    2 non-null      int64
 2    MR     2 non-null      int64
 3    JA     2 non-null      int64
 4    TBOL   2 non-null      int64
 5    G      2 non-null      int64
 6    TL     2 non-null      int64
 7    THM    2 non-null      int64
 8    R      2 non-null      int64
 9    A      2 non-null      int64
 10   GIJ    2 non-null      int64
 11   ST     2 non-null      int64
 12   P      2 non-null      int64
dtypes: float64(1), int64(12)
memory usage: 340.0 bytes
None
Analysing the Data
After cleaning up the data, it's time to actually analyse it. And that's even easier, because, in Python, it's just .describe().
Because this brings in a lot of information, I'm switching it to just the Funko columns, because six columns are easier than 13.
import pandas as pd

figure_data = pd.read_csv("data.csv", header=0, sep=",")

pd.set_option('display.max_columns',None)

print(figure_data.describe())
(set_option means there isn't a limit for the number of columns it displays. Since I have 6 columns, it'd be good to not leave any out.)
This gives me:
        SW        TBL       MR        JA        TBOL      G
count   2.000000  2.000000  2.000000  2.000000  2.000000  2.000000
mean    9.500000  0.500000  0.500000  0.500000  0.500000  0.500000
std     4.949747  0.707107  0.707107  0.707107  0.707107  0.707107
min     6.000000  0.000000  0.000000  0.000000  0.000000  0.000000
25%     7.750000  0.250000  0.250000  0.250000  0.250000  0.250000
50%     9.500000  0.500000  0.500000  0.500000  0.500000  0.500000
75%    11.250000  0.750000  0.750000  0.750000  0.750000  0.750000
max    13.000000  1.000000  1.000000  1.000000  1.000000  1.000000
Which is a lot, yes. But to break it down:
- Count: The number of observations
- Mean: The average value
- Std: The standard deviation
- Min: The lowest value
- 25%, 50%, 75%: Percentiles
- Max: The highest value
Standard deviation and the percentiles will be explained in the Statistics chapter, but there you go. All the data for a small collection of action figures. Neat!
Day 2 — Results
- To get the biggest number, you use
max(). - To get the smallest number, you use
min(). - To get the mean, you have to import in NumPy before you can use
mean(). - Pandas can read CSVs by using
.read_csv(). Put in the import name before the., and then in the(), put in the CSV file name, what row the header is on, and what is separating the data. Sopd.read_csv("data.csv", header=0, sep=",") - If you need to clear out any
NaNin your data, use.dropna(axis=0,inplace=True). axis=0removes all the rows withNaNin them.- Data can be quantitative (either discrete or continuous) or qualitative (nominal or ordinal).
- You can have Pandas tell you what kind of data you have by doing
.info()on your data variable. - If you're gonna be doing maths on it, you want
int64orfloat64. - If you need to turn it into one of those, you can use
.astype(TYPE)to the column name. So, like,figure_data['SW'].astype(float)turns all the data in theSWcolumn intofloat64. - To analyse the data, you use
.describe(). - That'll give you the count, the mean, the standard deviation, the minimum, the maximum, and the 25%, 50%, and 75% percentiles.
- If you want to make sure you get all the columns, you need
pd.set_option('display.max_columns',None)
This was still a lot, wasn't it? Next time, it's all mathematics, so I will probably freak out. I think I'll save that all for Monday.
Today's Sticker
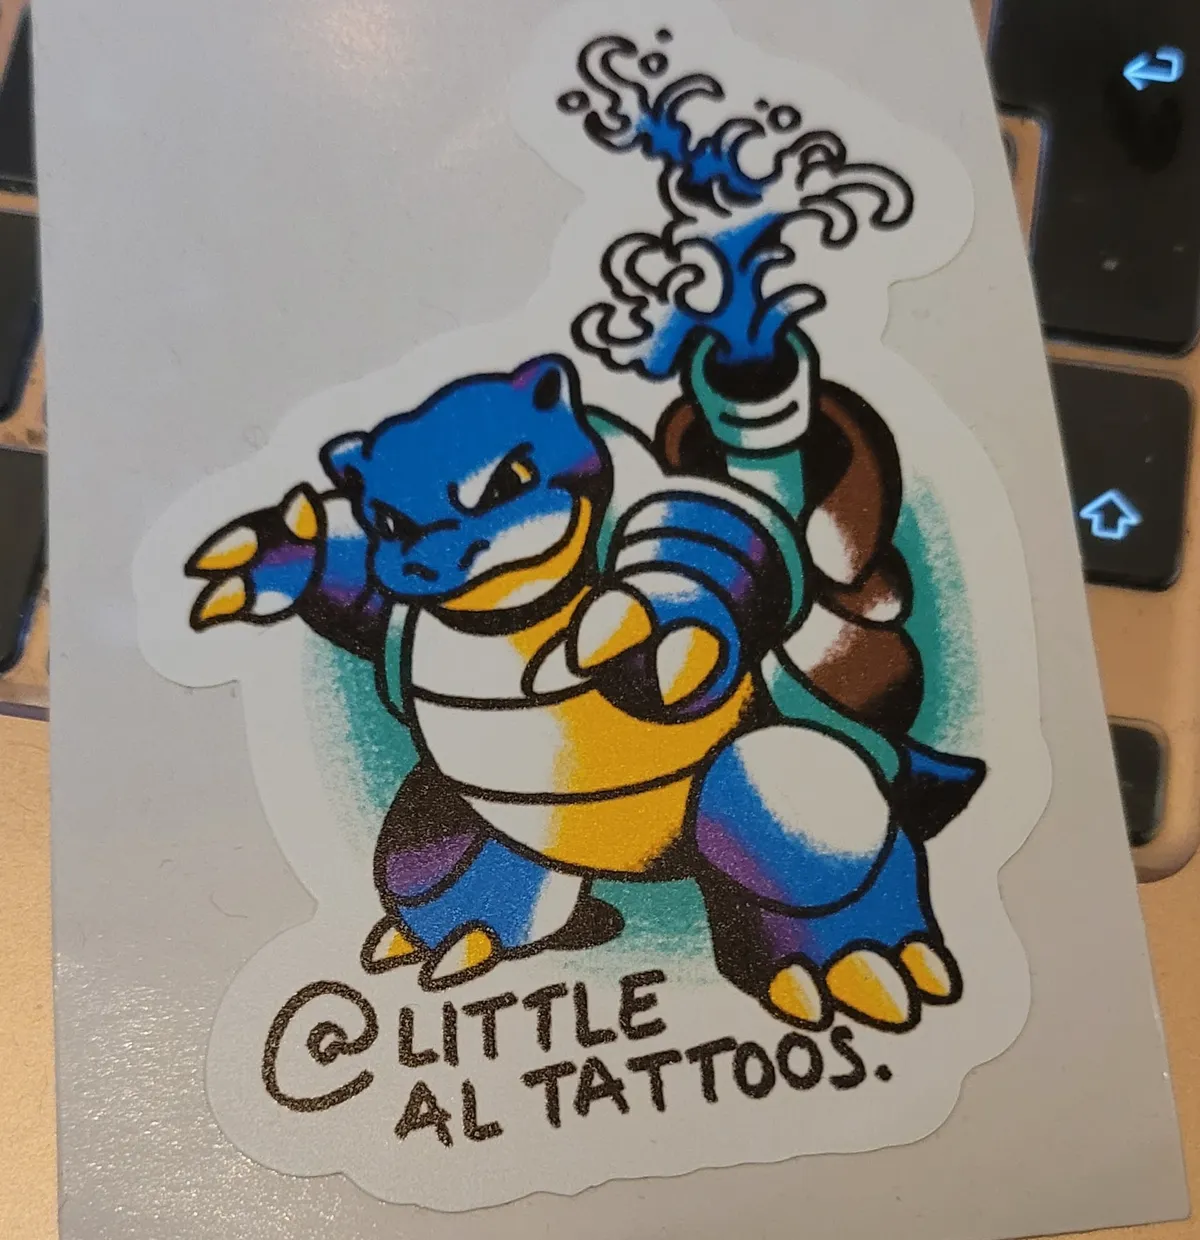
I got this awesome Blastoise sticker from Little Al Tattoos at the Big Tattoo Meltdown. I'm still trying to figure out a good Twin Peaks themed tattoo...maybe American Traditional would be nice. Hmmm.