Learning Statistics, Day 2 - Introduction to Statistics, Day 2
And we're back into statistics!
It saves me from obsessively refreshing the "Grades" page for my Disruptive Technologies in the Digital Economy submissions. Come on, it's been a month already, just tell me if I passed or not.
No, I need to stop looking at that. I need to think about statistics.
Prediction and Explanation
What do you use statistics for? Predicting things and explaining things. Yep, that is how it is.
I don't know how I feel about this section though:
Some statistical methods are not focused on explaining how things are connected. Only the accuracy of prediction is important.
Many statistical methods are successful at predicting without giving insight into how things are connected.
I think this is why I always side-eye business forecasting. I need to see how everything is connected before I agree "Yes, if we do that, we will increase this."
I mean, the linear regression I did in the Data Science course let you see how the variables were connected and then you could predict what would happen when you changed the explanatory variable, but... I don't know. I guess I'll have to see what happens.
I am side-eyeing this pretty hard though:
Some types of machine learning let computers do the hard work, but the way they predict is difficult to understand. These approaches can also be vulnerable to mistakes if the circumstances change, since the how they work is less clear.
Like, great, fantastic, point out that machine learning can lead to mistakes, but "the way they predict is difficult to understand"? Okay, yeah, maybe I don't know the detailed maths involved, but I'm kinda sure there's a way to explain it.
The section on explanation is a little better. And this part?
If we are looking at complicated situations, many things are connected. To figure out what causes what, we need to untangle every way these things are connected.
Mmmmm yesssssss give it to me. Give me the weird giant amazing tangle and let me see how everything connects. Nice.
Population and Samples
Population is everything that we want to learn about. A sample is part of the population. We want a representative sample of the population so we can make good inferences about the general population.
So let's say I wanted to do statistics on films that I've seen. I go to Letterboxd and see that I've listed over 2,000 films as being "watched".
That's way too many to go through. So I'm going to get a sample.
Maybe I'll do a sample based on release date decades. Which might work if I choose, like, 1990s (257 films), but not if I choose the 1910s (3 films).
I could choose a sample based on genre, but, again, there's a pretty stark difference between, say, Science Fiction (580 films) and Western (26).
So, yeah, making sure you have a representative sample can be difficult.
Parameters and Statistics
A parameter is a number that describes something about the whole population, and a sample statistics is a number that describes something about the sample.
Parameters are usually what we want to find out, and the sample statistics can give us estimates for the parameters.
So to go back to my film stats. If I set my sample to "Films I've seen that were released in the 1990s" (257 films) and then set the genre to "Science Fiction" (69 films), then I could estimate that 27% of all the films I watch will be science fiction films.
So when I apply that number to the 461 films I've seen that were released in the 2010s, it should be 124 films.
It turns out that I saw 158 science fiction films in the 2010s, so maybe the 1990s aren't a proper representation. But it's not a terrible estimate.
And those 34 additional films would be my variance. So I'd say "In the 2010s, I saw 124 science fiction films, plus or minus 34."
(On the other hand, the estimate works a treat for the 1910s. Yes, out of the 3 films I saw, 1 was science fiction.)
Study Types
The main types of statistical studies that are used are observational and experimental.
Experimental is when you're testing hypotheses and trying to figure out whether or not something is the cause of another thing. So, like, medical studies. Does this new drug reduce the prevalence of this disease as compared to not giving out the drug?
Observational is when you're gathering the data, but you don't change anything. So, like, in medical studies, you track the height of children over the decades, but you're not actively trying to make one child taller than the other.
Sample Types
So how do you get your sample population? There are a bunch of different ways.
Random Sampling
This is probably the best type of sample to have, where you just pick randomly. It means it'll be pretty representative, because you're not actively looking for certain participants – you just take what you're given. It's difficult to make sure that it is completely random, but it can be close enough.
Convenience Sampling
This is where you pick whichever participants that are the easiest to reach. So, like, opinion polls. You're going to get whoever wants to talk, especially when you throw money at them. Hell, I regularly do surveys and opinion polls just for random gift cards.
It gets funnier when it's obviously a political party trying to determine the best route for their next policy, especially when it's immigration.
(Why, yes, there is a problem with immigration in this country. There isn't ENOUGH.)
Systematic Sampling
This is when participants are chosen by a regular system, like the first 10 people who have lined up, or every 5th number on the giant CSV you have.
It can be random, especially if, like, in that giant CSV, you haven't bothered to sort the data by anything just yet, but, like, if you've sorted by name already, and you're like "the first 20", you're going to have a lot of As.
Stratified Sampling
This is where you split the population into smaller groups (strata). So breaking up the movies I've watched into genres would be a stratified sampling.
And then, from there, I can go "Okay, let's pick 2 films from each genre at random" and that will be my sample population.
Clustered Sampling
This is a lot like stratified sampling, but the smaller groups (clusters) tend to occur more naturally. So it'd be if I chose decades for my films, because being from the 1970s is just the truth for Westworld, rather than trying to classify it as a western or a science fiction film.
Once you have your clusters, you can choose the entire cluster at random, or choose members from the different clusters randomly.
Data Types
We did data categories on Day 2 of Data Science, but we can go over them again.
Qualitative data
This is information that can be described by categories. So, like, brands. Professions. Genres.
We can take data that is identified by this qualitative data and calculate proportions. Like how 27% of the films I've seen from the 1990s were science fiction films.
Quantitative data
This is information that can be described by numbers. Income. Age. Height. Logged films.
Which you can then calculate averages and ranges and all that other mathematical stuff from. I've logged 91 films this year so far, so I've averaged around 2.5 films per week.
Measurement Levels
You need to know how you're measuring your data in order to present it as well as possible. And we're not just talking about changing the scale on the graph so that your line actually shows up.
Nominal Level
Categories that don't have any sort of order to them. I mean, okay, you can alphabetise them, but, really, that's just arbitrary.
Genres. Brands. Colours. Genders. That sort of thing.
Ordinal Level
These are categories, but you can put them in order. So, like, ranks. Or star ratings. Or letter grades.
(No, you're checking your coursework grades. Not me. Nope!
Still not there. Dammit.)
The distance between the different levels doesn't really mean anything, though. Like, is an Admiral twice as important as a Commodore? Does that mean that a Lieutenant is also twice as important as an Ensign?
(I've been listening to a lot of Vorkosigan Saga audiobooks. The military language has stuck in my brain.)
Interval Level
Data that can be ordered and has a objectively important distance between. There might not be a natural 0, where the scale starts, but you can take steps.
So, like, years in a calendar. You know that, no matter what, that year will increase by 1 each time the calendar turns over. Or decades. You can go back to 1870s for films, but you can't go back to 0, because films were invented yet.
Ratio Level
These are definitely numbers and definitely have a natural 0 value. So we're talking Money. Age. Time. Films watched. You can chart this and you can compare precisely the difference between the values. I saw 4 films on that day. That is 3 more than I saw on this day.
Day 2 — Results
- You use statistics to predict things and explain things.
- Population is what we want to study.
- Samples are part of the population that we use.
- You want your sample to be representative of the population.
- A parameter is something that describes the whole population.
- A statistic is something that describes the sample.
- You use the statistic to estimate the parameter.
- Experimental studies are when you're trying to figure out if one variable causes another variable.
- Observational studies are when you're juat gathering and reviewing the data.
- You can get your sample by random, convenience, systematic, stratified, or clustered.
- Random is random, convenience is whatever's easiest, systematic is by a system, stratified breaks up your population into strata, and clustered breaks your population into clusters.
- There's qualitative and quantitative data. Qualitative is categories. Quantitative is numbers.
- There are four measurement levels – Nominal (names), Ordinal (ranks), Intervals (steps), and Ratios (numbers).
Tomorrow I start with Descriptive Statistics, where we're going to organise weird data and make weird charts. I will insist upon the weirdness, oh yes.
Today's Sticker
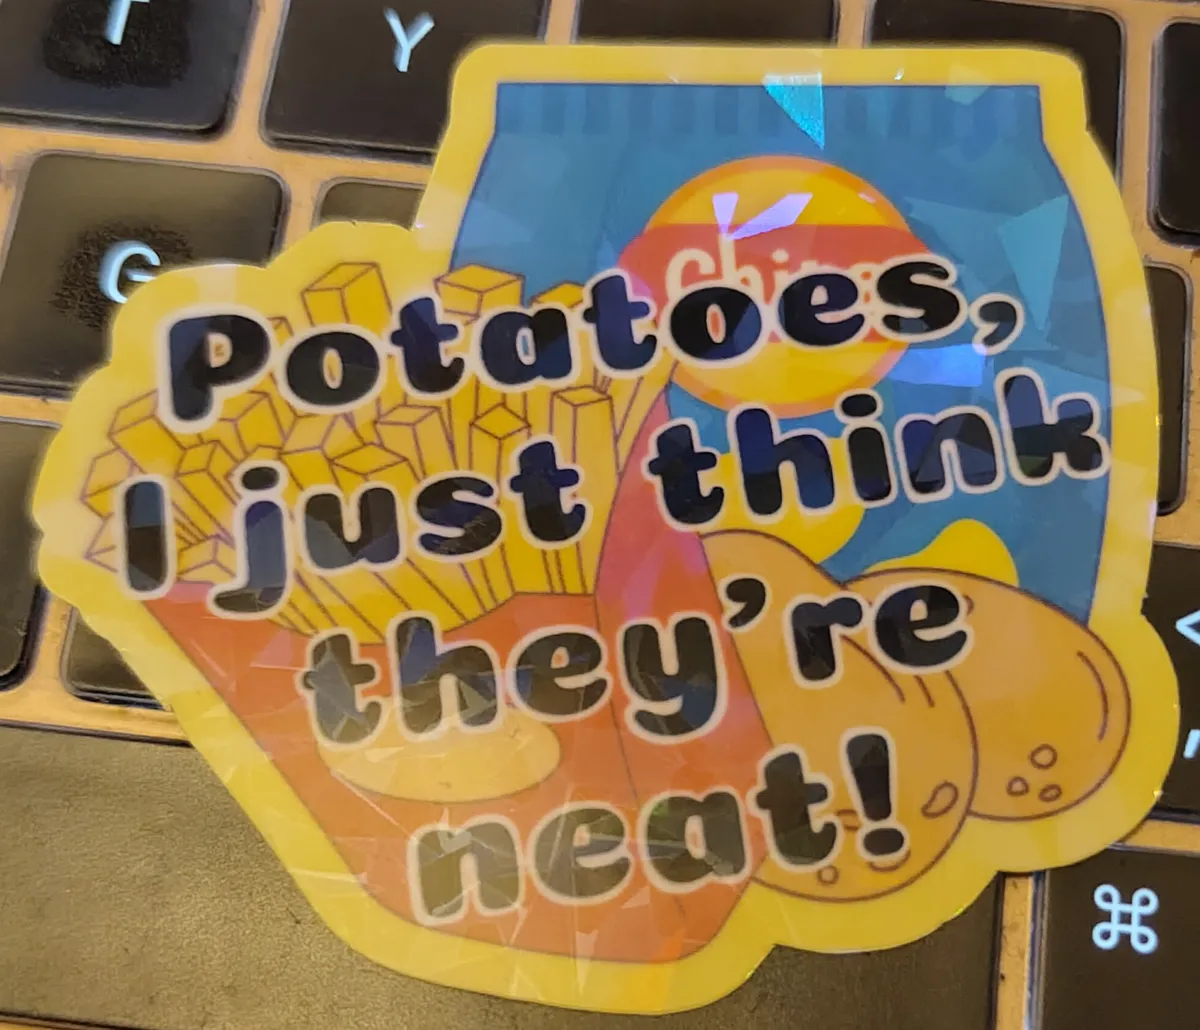
You're right, Marge. Potatoes are neat.
I got this funky holographic sticker from Geek Culture Kingdom at EN-Com ages ago. But I am delighted she is still selling this sticker, because yes, potatoes are neat.